I once helped a friend work out whether her ceramics business was actually profitable. She had been selling at markets for two years and reinvesting everything that came in. When I asked what her break-even point was, she gave me a blank look. She knew she was "covering costs" — she just could not say at what volume that became true. We sat down with a spreadsheet for an hour. The answer surprised her. She was selling about 40% more per month than she needed to break even, which was genuinely good news. But she had also been pricing several product lines below their individual break-even, subsidised by her bestsellers without realising it.
What Break-Even Actually Tells You
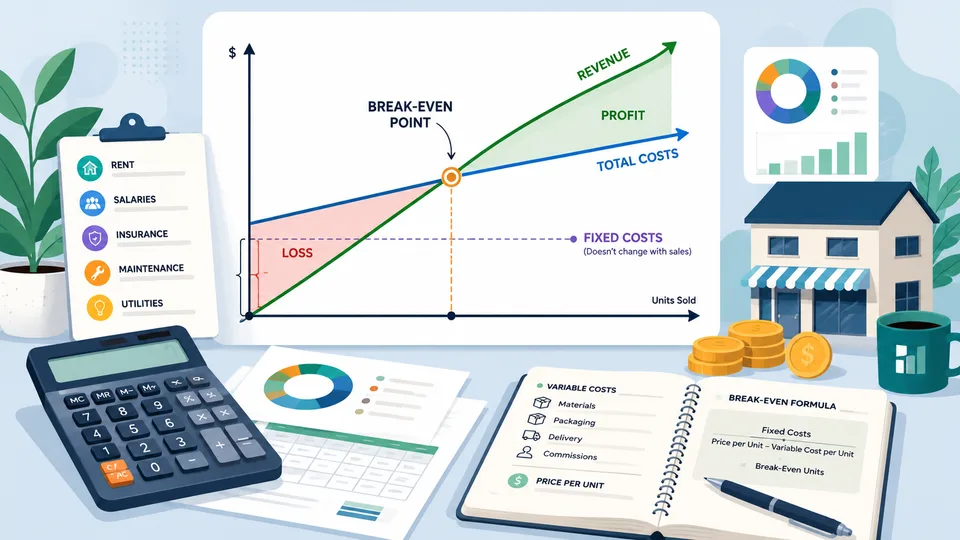
Break-even is the point at which total revenue equals total costs — the moment the business stops losing money and starts making it. Every unit sold beyond that point contributes directly to profit. Every unit sold below it means the business is operating at a loss, regardless of how busy it feels. The calculation splits costs into two categories: fixed costs, which do not change with sales volume (rent, insurance, software subscriptions, loan repayments), and variable costs, which increase with each unit produced or sold (materials, packaging, payment processing fees, shipping). Understanding which costs are which is the first step, because many business owners misclassify them.
The Contribution Margin: What Each Sale Actually Contributes
Before calculating break-even, you need the contribution margin — the amount each unit contributes toward covering fixed costs after variable costs are deducted. If a product sells for £40 and the variable cost to produce and deliver it is £16, the contribution margin is £24. Every sale of that product contributes £24 toward fixed costs. Once fixed costs are covered, that £24 becomes profit. The contribution margin ratio — contribution margin divided by selling price — tells you what percentage of each pound of revenue flows toward fixed costs and profit. A ratio of 60% means 60p of every £1 in revenue is available to cover fixed costs and, eventually, generate profit.
The Formula and How to Apply It
Break-even units = Fixed Costs ÷ Contribution Margin per Unit. If monthly fixed costs are £3,600 and the contribution margin per unit is £24, break-even is 150 units per month. Below 150, the business loses money. Above 150, every additional sale generates £24 in profit. For a service business with variable pricing — a consultant charging different rates for different projects, for example — the calculation uses revenue figures rather than units: Break-even revenue = Fixed Costs ÷ Contribution Margin Ratio. A break-even calculator handles this arithmetic and lets you model the effect of changing prices, costs, or volumes before making those decisions in the real business.
Why Break-Even Changes When You Change the Price
Pricing decisions are often made without modelling their effect on break-even. A 10% price reduction on a product with a 40% contribution margin ratio does not reduce profit by 10% — it reduces the contribution margin by 25%, because the variable costs stay the same while revenue falls. In the ceramics example, my friend had priced a range of small items at £12 to stay competitive. The variable cost per item was £8, giving a contribution margin of £4 and a ratio of 33%. Her bestselling medium pieces at £35 had a variable cost of £10 and a ratio of 71%. Every small item she sold was contributing very little to her fixed costs, while every medium piece was doing most of the work. Raising the small item price to £15 increased her contribution margin by 75% and reduced her break-even unit count significantly.
Break-Even in Service Businesses: Hours, Not Units
For service businesses — agencies, consultancies, freelancers, tradespeople — the break-even calculation uses billable time rather than physical units. Fixed monthly costs divided by the hourly rate gives the minimum billable hours required to break even. A graphic designer with £2,400 in monthly fixed costs charging £60 per hour needs 40 billable hours per month to break even. At 30 hours, they are losing money regardless of how busy their calendar looks. The practical implication is that time spent on non-billable work — admin, proposals, networking, professional development — has a direct cost in break-even terms. Each non-billable hour either requires more billable hours elsewhere or a higher rate to compensate.
Stress-Testing the Model Before Committing to It
Break-even analysis is most useful not as a one-time calculation but as a planning tool. Before launching a new product line, taking on premises, hiring a member of staff, or signing a fixed contract, running the break-even calculation against realistic sales projections tells you whether the numbers make sense. If break-even requires selling 200 units per month and the current product sells 80, the new cost is not affordable at current volume. This is not a reason to abandon the plan — it is a reason to understand what sales increase is required to justify it and whether that increase is realistic. Many small businesses take on fixed costs that seemed manageable at the time and then find break-even has shifted to a point that requires sustained effort to maintain.
The Difference Between Break-Even and Profitability
Breaking even means covering all costs. It does not mean the business is healthy, growing, or generating a return on the owner's time. A sole trader working 50 hours a week and breaking even is effectively earning nothing for their labour — every pound of revenue is absorbed by costs. The target should not be break-even as a destination, but as a floor below which operations are loss-making. The meaningful question is not "are we covering costs?" but "what is our profit margin above break-even, and is it sufficient to justify the risk, time, and capital invested?" Break-even gives you the baseline. Profit above break-even is the point of the business.
Multiple Products: Break-Even Across a Mixed Portfolio
Most businesses sell more than one product or service, and break-even analysis gets more complex when the sales mix is variable. A simple approach is to calculate a weighted average contribution margin based on the expected proportion of each product in total sales. If 60% of sales are Product A with a contribution margin of £30 and 40% are Product B with a contribution margin of £15, the weighted average contribution margin is (0.6 × £30) + (0.4 × £15) = £24. Divide fixed costs by this weighted figure to get total break-even units, then apply the sales mix percentages to find the required volume of each product. The limitation is that the calculation depends on the assumed sales mix remaining constant. If actual sales skew toward low-margin products, break-even rises and may not be met at the volumes originally planned. Reviewing the break-even analysis whenever the product mix shifts significantly keeps the model accurate. For businesses with seasonal patterns, running separate break-even calculations by period — rather than annual averages — reveals months where the business is structurally loss-making and requires working capital cover, even when the annual picture looks comfortable.