The first time I calculated the true cost of acquiring a customer for a small business I was advising, the number came back nearly three times what the owner expected. She had been tracking what she spent on Facebook ads each month and dividing it by the number of people who clicked through. The problem was that most of those clicks did not convert to paying customers — and the ad spend was only one part of the picture. Once we added the time spent managing the campaigns, the design costs for creatives, the CRM subscription used to track enquiries, and the follow-up calls that eventually closed deals, the real cost per acquired customer was £340. She had been estimating £120. That gap is the difference between a profitable acquisition model and one that is quietly destroying margin.
What Cost Per Acquisition Actually Includes
Cost per acquisition (CPA), often used interchangeably with customer acquisition cost (CAC), is the total cost of acquiring one new paying customer. The total includes every expense tied to the acquisition process: advertising spend across all channels, agency or freelancer fees for campaign management, design and creative production costs, marketing software and CRM tools, sales team salaries and commissions, and the time of any internal staff involved in the sales process. Businesses that track only media spend are systematically underestimating CPA. In many small businesses, internal time is the largest acquisition cost — it just does not appear on a marketing invoice.
The Calculation and Why the Time Period Matters
CPA = Total Acquisition Costs ÷ Number of New Customers Acquired, measured over the same period. Using a monthly figure is standard. If total acquisition-related costs in April were £8,500 and 25 new customers were acquired, CPA is £340. The time period matters because acquisition often has a lag: a customer acquired in April may have first encountered the business in February through a campaign that ran then. Attributing acquisition cost to the period the customer converted rather than the period marketing ran can distort the figure. Comparing CPA month-to-month is more useful than obsessing over a single month's number, because trends — whether CPA is rising or falling as volume changes — are more informative than snapshots. A CAC calculator helps you track this consistently across channels and campaigns.
CPA by Channel: Where the Real Insight Is
A blended CPA across all acquisition channels is useful as a starting point but conceals important variation. A business running paid search, paid social, and referral programmes simultaneously may find that paid search CPA is £120, paid social is £480, and referrals generate customers at £60 in incentive costs. The blended figure of £220 suggests reasonable efficiency, but the underlying data argues for radically different resource allocation. Tracking CPA by channel separately requires consistent attribution rules — deciding how to credit a customer who first found the business through social media and then converted via a Google search — but even imperfect channel-level data is substantially more useful than a single blended number.
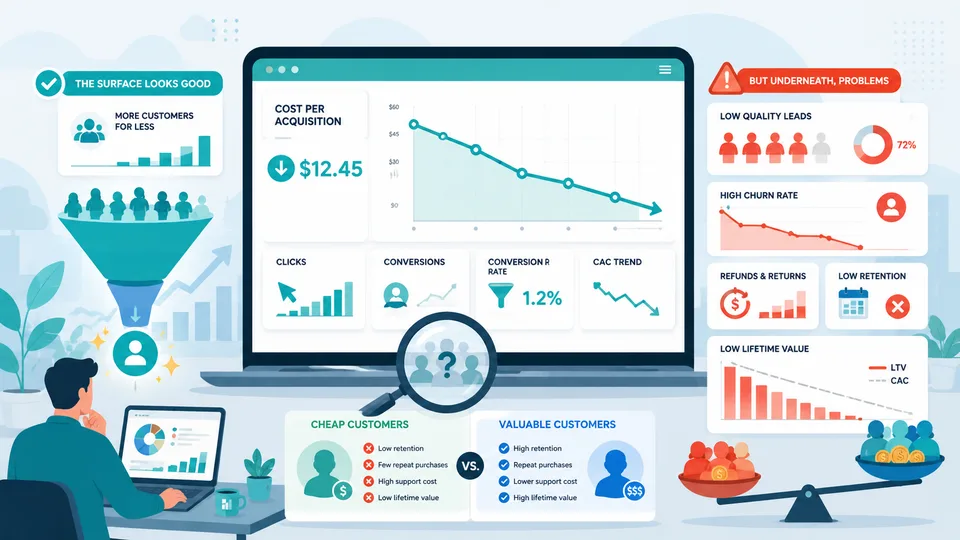
CPA and LTV: The Ratio That Determines Whether Acquisition Is Sustainable
Knowing CPA in isolation tells you how much you spend to acquire customers. Knowing the ratio of CPA to customer lifetime value (LTV) tells you whether that spend is justified. A business with a CPA of £340 and an LTV of £1,200 has a healthy ratio. A business with a CPA of £340 and an LTV of £380 is barely recovering acquisition costs before the customer relationship ends. The commonly cited benchmark for sustainable SaaS and subscription businesses is an LTV:CAC ratio of at least 3:1, though the appropriate ratio depends heavily on gross margins and payback period. For transactional businesses with lower retention, the question is whether a single transaction generates enough gross profit to justify the acquisition cost plus the cost of serving the customer.
CAC Payback Period: How Long Before You Get Your Money Back
LTV:CAC ratios look appealing on paper but can mask a cash flow problem. If CPA is £340 and the average customer generates £40 per month in gross profit, payback is 8.5 months. During those 8.5 months, the business has invested in that customer relationship but not yet recovered the acquisition cost. For a business growing rapidly and acquiring many customers simultaneously, this creates a compounding cash deficit. Every new customer acquired pushes the total unrealised acquisition investment higher. Understanding payback period is essential for cash flow planning, particularly in businesses that are growing — because growth accelerates the cash consumed before acquisition costs are recovered.
Reducing CPA Without Reducing Volume
The instinct when CPA is high is to cut advertising spend. A more productive approach is to improve conversion at each stage of the acquisition funnel. If 1,000 people click an ad and 20 become customers, CPA is determined by both the cost per click and the 2% conversion rate. Improving conversion to 4% halves CPA without changing the ad budget. The highest-leverage conversion improvements are usually at the bottom of the funnel — the proposal, the sales call, the trial experience — because that is where acquisition investment is closest to converting into revenue. Top-of-funnel optimisation (better targeting, more relevant creative) reduces wasted spend. Bottom-of-funnel optimisation makes the spend that reaches qualified prospects more effective.
Benchmarking CPA Against Industry Standards
CPA benchmarks vary enormously by industry and acquisition channel. E-commerce businesses selling fast-moving consumer goods may have CPA targets of £15–60. B2B software companies with annual contract values of £10,000+ may operate with CPA targets of £2,000–8,000. The figure that matters is not the absolute number but the relationship between CPA and customer value: whether the economics of acquisition are sustainable at current margins and retention levels. Industry CPA benchmarks are useful for a sanity check — if your CPA is ten times the industry average, there is likely a structural problem in the acquisition funnel or the attribution methodology — but they should not replace the internal calculation of what CPA is affordable for your specific business model. A business with high retention and strong expansion revenue can sustain a much higher CPA than a transactional business with one-off purchases, even in the same sector.
CPA Over Time: What the Trend Tells You
CPA changes over time, and the direction matters as much as the current level. Rising CPA in a scaling business often reflects channel saturation: the most efficient inventory has been purchased and less efficient placements are now required to maintain volume. This is a natural constraint that limits how far any single acquisition channel can scale without increasing CPA. Falling CPA as volume increases suggests improving conversion efficiency — usually the result of better creative, improved targeting, or landing page optimisation. Monitoring CPA trend against volume growth reveals whether the acquisition model is becoming more or less efficient as the business scales, which determines whether growth is sustainable or whether an alternative acquisition strategy will be needed as current channels saturate.
The businesses that manage CPA most effectively tend to share one habit: they calculate it monthly, at the channel level, and compare it against LTV and payback period simultaneously rather than in isolation. That discipline — treating acquisition cost as one variable in a connected model rather than a standalone number — is what separates marketing teams that can justify and scale their budgets from those that report activity metrics without being able to demonstrate that those activities are generating economic value.
What to do next
Use the ideas above as a starting point — then connect them to your own numbers and related guides on Calc It Anything.
- Read the small business finance and growth guide for the wider cluster.
- Compare with What Is LTV:CAC and Why Every SaaS Founder Should Know It.
- Compare with What Is a Good LTV to CAC Ratio?.
- Run the relevant calculator on this site with your own inputs before making a decision.
Related reading
- small business finance and growth guide
- What Is LTV:CAC and Why Every SaaS Founder Should Know It
- What Is a Good LTV to CAC Ratio?
- Understanding Conversion Rates Without Fooling Yourself
Frequently asked questions
What LTV:CAC ratio is healthy for early-stage SaaS?
Many B2B SaaS teams aim for roughly 3:1 once gross margin and payback period are factored in, but consumer or low-margin models may need a higher ratio. Model your own payback months, not just the headline ratio.
Should I calculate LTV:CAC by channel or in aggregate?
Both. Company-wide ratios hide unprofitable channels subsidised by efficient ones. Segment by acquisition source and customer tier before reallocating spend.
Which lever usually moves LTV:CAC fastest?
Retention often beats cutting acquisition spend because churn sits in the LTV denominator. A one-point churn improvement can matter more than a double-digit CAC reduction.