The first time I noticed a standard deviation figure printed on a blood test result, I skipped over it. My result was inside the reference range, so I treated the SD as irrelevant. What I didn't understand at the time was that the reference range is the standard deviation — "normal" on most clinical blood tests is defined as the mean value of a healthy population ± 2 standard deviations, which captures roughly 95% of healthy results by definition. Once I understood that, I started reading results differently. A result near the edge of "normal" means something quite different from a result near the middle, and the SD is the number that makes that distinction precise. Standard deviation is what gives reference ranges their meaning.
What It Measures
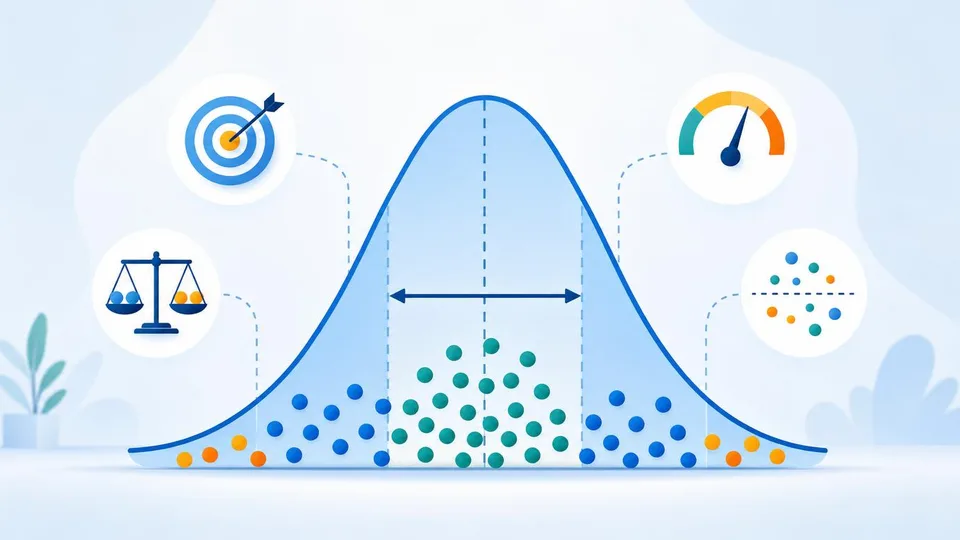
Standard deviation (abbreviated SD, or σ for a population) measures how spread out the values in a dataset are around the mean (average). A small SD means the values cluster tightly around the mean. A large SD means they're scattered widely. Two datasets can have identical means but very different standard deviations — and that difference often matters more than the mean itself.
Example: two classes both average 65% on a maths test. Class A has individual scores clustered between 60–70%. Class B has scores ranging from 20% to 95%. Both classes average 65%, but Class B has a much larger standard deviation. A teacher looking at just the average would miss the fundamental difference between the two groups.
The Calculation (Simplified)
For a dataset: find the mean → subtract the mean from each value and square the result → average all those squared differences → take the square root. The final number is the standard deviation. Squaring and then taking the square root ensures all differences contribute positively (we care about how far values are from the mean, not which direction) and gives the result in the same units as the original data.
The 68-95-99.7 Rule
For data that follows a normal distribution (the bell curve), a powerful rule applies: approximately 68% of values fall within one standard deviation of the mean, 95% within two, and 99.7% within three. This is called the empirical rule or the 68-95-99.7 rule.
In practice: if adult male heights in the UK have a mean of 175.3 cm and an SD of 7 cm, then about 68% of men are between 168.3 cm and 182.3 cm (within one SD). About 95% are between 161.3 cm and 189.3 cm. Being over 196.3 cm (three SDs above the mean) puts someone in roughly the tallest 0.15% of the male population.
When Data Isn't Normally Distributed
The 68-95-99.7 rule only applies to normally distributed data. Many real-world datasets are skewed — income distribution is heavily right-skewed (a small number of very high earners pull the mean well above the median), house prices are similarly skewed. For skewed data, the standard deviation is still meaningful as a measure of spread, but the empirical rule percentages don't apply. A high SD combined with a skewed distribution often means the spread is driven by a small number of extreme outliers rather than genuine variability across the dataset.
Practical Uses
Investment analysis uses standard deviation as a measure of volatility. A fund with a higher SD has larger swings — both upward and downward — than a lower-SD fund with the same average return. Quality control uses SD to monitor process consistency — if a machine is producing components with a rising SD in their dimensions, something is drifting in the process. Medical reference ranges (such as "normal" ranges for blood test results) are often defined as the mean ± 2 SDs of the healthy population, capturing approximately 95% of normal results.
Our probability calculator works with binomial distributions, showing the expected value (mean) and the spread of outcomes for repeated probability trials — a practical way to see standard deviation operating in a real scenario.
Standard Deviation vs Standard Error
These are often confused. Standard deviation describes the spread of values in a dataset. Standard error describes the uncertainty in the calculated mean — it's the SD divided by the square root of the sample size. A large sample reduces the standard error (the mean estimate becomes more reliable) without changing the standard deviation of the underlying data (the data is still as spread out as it always was). Clinical studies report standard errors and confidence intervals around measured effects; consumer data tends to report standard deviation as a description of the dataset's variability.
Z-Scores: How Far from Normal Is That Result?
Once you understand standard deviation, a closely related concept becomes immediately useful: the Z-score. A Z-score expresses how many standard deviations a particular value sits above or below the mean. The formula is Z = (value − mean) ÷ standard deviation.
In the blood test example from earlier: if the mean for a particular marker in a healthy population is 5.0 with an SD of 0.8, and your result is 6.6, your Z-score is (6.6 − 5.0) ÷ 0.8 = 2.0. You're two standard deviations above the mean — at the boundary of the range that captures 95% of healthy results. That's useful information. It tells you that your result is at the edge of normal rather than in the middle, which may or may not be clinically significant depending on the specific marker, but is a more precise description of your position than "within range".
Z-scores appear in quality control, finance, academic testing, and anywhere that individual results need to be positioned within a distribution. A Z-score below −3 or above +3 is genuinely rare — less than 0.3% of a normally distributed population falls there. One between −1 and +1 is the middle 68% — the majority of any normally distributed group. Getting comfortable with Z-scores converts standard deviation from an abstract measure of spread into a practical tool for positioning any individual result.
Related calculator: Use our Standard Deviation Calculator to calculate spread, variance, and mean from your own dataset.