When I was researching salaries for a potential career move in my late twenties, I kept finding "average" figures that felt completely detached from what people in the field actually told me they earned. One role was listed with an average salary in the low fifties. Everyone I spoke to was either a recent graduate on £28,000 or a senior specialist on £75,000. I couldn't find anyone in the middle of that range. Eventually I realised the figures I was reading were means, pulled upward by a relatively small number of high earners at the senior end of the distribution. The median for the same roles was considerably lower. Both figures were technically accurate. Only one told me what I actually needed to know.
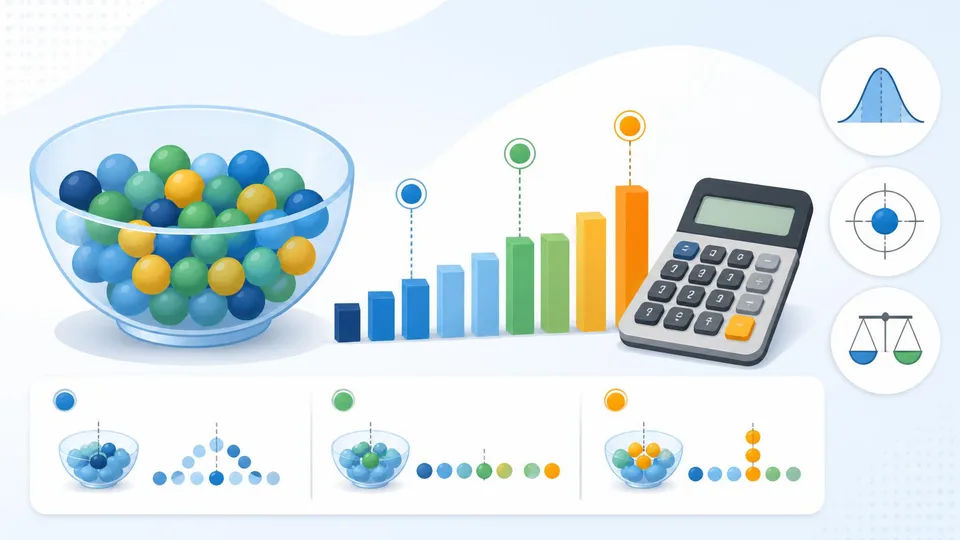
The Mean
The mean (arithmetic mean) is what most people mean when they say "average": add up all the values and divide by the count. Five houses sell for £280,000, £310,000, £295,000, £320,000, and £580,000. Mean = (280,000 + 310,000 + 295,000 + 320,000 + 580,000) ÷ 5 = £357,000.
The problem: that £580,000 sale is pulling the mean well above what four of the five houses actually sold for. The mean is sensitive to outliers — extreme values drag it toward them.
The Median
The median is the middle value when all values are sorted in order. For an odd number of values, it's the single middle value. For an even number, it's the average of the two middle values. In our five-house example, sorted: £280,000, £295,000, £310,000, £320,000, £580,000. The median is £310,000 — the middle value.
The median is resistant to outliers. That £580,000 sale doesn't affect the median at all; it affects only the mean. For house prices, income data, and anything else with significant positive skew, the median is typically the more informative summary.
The Mode
The mode is the most frequently occurring value. In the dataset [3, 4, 4, 5, 7, 7, 7, 9], the mode is 7 because it appears three times. For continuous data where no value repeats exactly, the mode is less useful than for categorical or discrete data. It's most practical for questions like "what's the most common shoe size sold?" or "which response option did most survey participants choose?"
Which to Use When
Use the mean when data is roughly symmetrically distributed without extreme outliers. Use the median when data is skewed, when outliers are present, or when you want to answer "what's the typical experience of someone in the middle of this distribution?" Use the mode for categorical data, or when the most common value is more meaningful than a calculated average.
Our probability calculator shows the expected value (a probability-weighted mean) for event distributions — a practical way to see the mean operating in a probability context.
Why Reported Averages Are Often Misleading
UK average salary statistics are a classic example. In 2024, the mean gross annual salary was around £37,000, while the median was around £28,000. The gap is caused by high earners — the top 1% earn enough to pull the mean significantly above what most workers earn. Reporting the mean gives the impression that a "typical" worker earns £37,000. Reporting the median more accurately reflects what a worker in the middle of the distribution actually earns.
Similarly, when news reports describe an "average" outcome, they often don't specify which average. A hospital with a mean waiting time of 4 hours might have a median of 2 hours (most people wait 2 hours or less) and a mode of 45 minutes (the most common wait). All three statements are true; all three convey different information.
The Average Person Fallacy
A final caution: the average of a group may not represent any individual in it. The "average" family in UK statistics has 1.89 children — a number no actual family has. The average body measurements for a fighter pilot in the 1950s fit virtually no actual pilot. Designing for the average can mean designing for nobody. When individual variation matters — ergonomics, nutrition, drug dosing, sizing — understanding the distribution is more useful than knowing the central value alone.
Weighted Averages: When Not Every Value Counts Equally
Standard averages treat every data point equally. Weighted averages assign different importance to different values depending on their relevance. The most familiar example is an exam grade where different assessments carry different weights: if coursework is worth 40% and the final exam is worth 60%, a student scoring 80 on coursework and 50 on the exam has a weighted average of (80 × 0.4) + (50 × 0.6) = 32 + 30 = 62. A simple mean would give (80 + 50) ÷ 2 = 65 — a different and less accurate picture of their overall performance.
Weighted averages appear in portfolio returns (weighted by the proportion of funds in each asset), customer satisfaction scores (weighted by how many customers fell into each rating category), economic indices (weighted by the size of each component), and review aggregators that weight recent reviews more heavily than old ones. When a weighted average is used without stating the weights, the figure can be shaped by how the weights are chosen — another reason to ask how a reported average was constructed, not just what it says.
Why You Can't Just Average Percentage Growth
A common mistake in financial calculations is taking the arithmetic mean of percentage returns. If an investment returns +50% in year one and −50% in year two, the arithmetic average return is 0% — implying you've broken even. In reality, £1,000 grows to £1,500 after year one and falls to £750 after year two. You've lost 25% overall, not broken even. The correct measure is the geometric mean: multiply the growth factors together and take the appropriate root. (1.5 × 0.5)^(1/2) − 1 = 0.866 − 1 = −13.4% per year. Geometric means are always lower than arithmetic means for variable returns, and the gap grows with volatility. This is why volatile investments are harder to recover from than stable ones with the same average return.
Related calculator: Use our Average Calculator to calculate mean, median, mode, and related statistics in one place.