I worked with a subscription business that had impressive growth charts. New subscriber numbers were rising every quarter. The marketing team was celebrated for their acquisition results. What the monthly reports did not show clearly was that cancellation rates were rising at almost the same pace. By the time someone finally plotted both lines on the same graph, it was obvious: the business was running a leaky bucket. Every month it was spending heavily to pour new customers in at the top while losing nearly as many at the bottom. Net active subscriber count had barely moved in twelve months despite significant marketing spend. The acquisition machine was working hard to compensate for a retention problem that had not been addressed.
The Mathematics of Churn
Monthly churn rate is the percentage of customers who cancel or do not renew in a given month. A 5% monthly churn rate sounds moderate until you calculate the implied average customer lifetime: 1 ÷ 0.05 = 20 months. At 2% monthly churn, the average lifetime is 50 months. At 10%, it is 10 months. These differences compound dramatically when you model lifetime value: a customer paying £50 per month with 60% gross margin generates £30 per month in gross profit. At 50 months average lifetime, LTV is £1,500. At 20 months, it is £600. At 10 months, it is £300. Churn does not just affect how long customers stay — it determines whether the economics of acquiring them in the first place make any sense. A churn impact calculator makes this visible immediately: a one-percentage-point reduction in monthly churn can increase LTV by 20–30% depending on the starting rate.
Why Acquiring New Customers Costs More Than Retaining Existing Ones
The oft-quoted statistic — that retaining a customer is five times cheaper than acquiring a new one — varies by industry, but the directional truth is consistent. Acquisition requires advertising spend, sales effort, creative production, and the onboarding resources needed to convert a new customer into an active one. Retention requires product quality, customer service, and proactive engagement with customers who show signs of disengaging. The asymmetry matters because acquisition costs are front-loaded: you spend the money before the customer is acquired and before you know whether they will retain. Retention spend is applied to customers who are already generating revenue, which makes it lower-risk by definition. Businesses that systematically underinvest in retention while overinvesting in acquisition are taking the harder, more expensive path to the same destination.
The Compounding Effect of Small Retention Improvements
Improving retention by a small margin has a disproportionate effect on revenue over time because the improvement compounds. A business with 1,000 active subscribers and 5% monthly churn loses 50 customers per month. At 4% churn, it loses 40 customers per month. That difference of 10 customers per month — each generating £50 in revenue — is £500 per month in revenue retained. Over 12 months, that is £6,000 in incremental annual revenue from a single percentage point of churn improvement, before accounting for the compounding effect of those retained customers also staying longer than they would have. Improving marketing efficiency feels like the urgent priority when growth is slow. Improving retention is usually the higher-leverage action, because it increases the value of every customer already acquired.
Which Customers Are Worth Retaining — and How to Tell
Not all customers are equally worth retaining. High-value customers — those with large order values, high purchase frequency, long tenure, or strong referral behaviour — represent disproportionate revenue. Losing them costs more than losing a customer who purchased once at minimum spend. The LTV calculator by segment helps prioritise where retention investment pays the highest return. Customer segments that have high average LTV but also high churn deserve specific retention programmes: proactive outreach, loyalty incentives, early warning systems that identify disengagement before it becomes cancellation. Applying the same retention approach to all customers regardless of their value is less effective than concentrating resources on the segments where retention ROI is highest.
Early Warning Signals That a Customer Is About to Leave
Most customers do not cancel abruptly. They disengage gradually: logins become less frequent, support tickets stop arriving, usage of core features declines, response rates to communications fall. The period of declining engagement before cancellation is a window in which proactive intervention can change the outcome. Businesses that track engagement metrics — login frequency, feature usage, email open rates, support contact patterns — can identify customers who are moving toward churn before they actually churn and take specific action. A personal outreach from a customer success manager, an offer to help with setup that was never completed, or a relevant use case demonstration timed to the disengagement period can recover customers who were weeks away from cancelling.
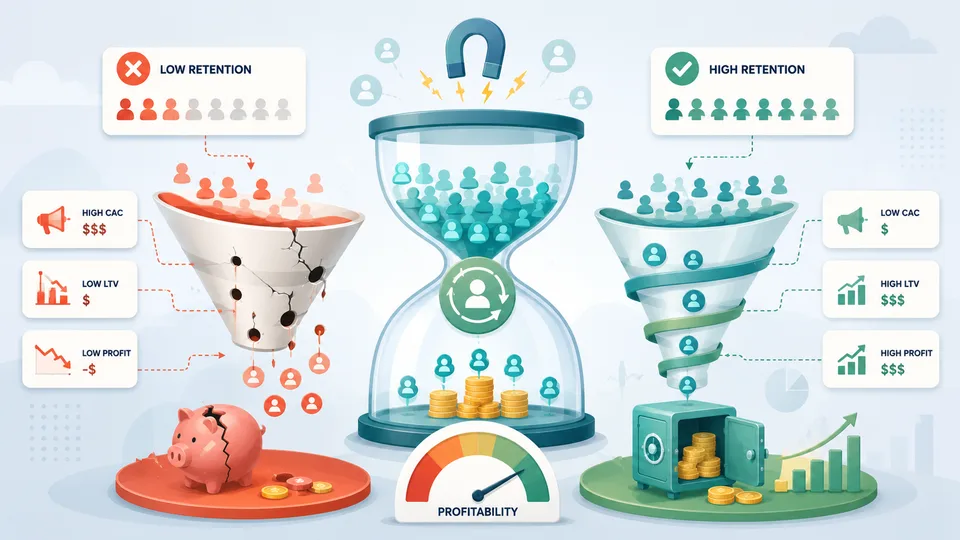
Retention and Marketing Profitability: The Direct Connection
Marketing profitability is not determined solely by acquisition efficiency. It is determined by the combination of CPA and LTV. Improving LTV through better retention makes every unit of acquisition spend more valuable: the same £340 spent to acquire a customer generates more lifetime revenue when that customer stays for 40 months instead of 20. This means that retention investment directly improves the economics of marketing — even though retention is usually managed by a different team and tracked in different dashboards. Businesses that measure marketing performance by acquisition metrics alone miss half the picture. The full return on marketing investment is visible only when the revenue generated over the customer's lifetime is compared against the cost of acquiring them.
Net Revenue Retention: The Metric That Explains Whether the Business Is Growing or Shrinking
Net revenue retention (NRR) — also called net dollar retention — measures the percentage of revenue retained from an existing customer cohort over a period, including expansions (upsells, cross-sells) and contractions (downgrades, cancellations). An NRR above 100% means the existing customer base is growing in revenue terms, even without adding new customers. An NRR below 100% means the business is shrinking among its existing customers and must acquire new ones just to stay flat. For subscription businesses, NRR is arguably a more important metric than churn rate alone, because it captures the full revenue impact of retention behaviour including expansion. Businesses with strong NRR can grow revenue purely through deepening existing customer relationships — a lower-cost, lower-risk path than pure acquisition growth. Businesses with weak NRR must run fast on the acquisition treadmill just to maintain current revenue, regardless of what the new customer growth metrics suggest. Monitoring NRR monthly alongside churn rate gives a complete picture of how the existing customer base is evolving — and whether the retention investment being made is working.
The subscription business I described at the start eventually fixed its problem — not by spending more on acquisition, which was already working, but by investing in onboarding improvements and proactive customer success outreach at the 60-day mark, which analysis had identified as the point where most cancellations were being decided. Monthly churn fell from 6.8% to 4.1% over eight months. At the existing subscriber volume, that improvement was worth more in recovered revenue per year than the entire marketing budget. The acquisition team had not changed a thing. The economics of everything they had ever spent had simply improved because the customers they brought in were now staying longer.