For the first two years of running a content marketing programme, I tracked page views as the primary metric of success. The numbers went up reliably and they felt like proof that the work was having an effect. Then someone asked me to connect those page views to revenue, and I could not do it. I could show that visits had grown. I could show that the blog ranked well for relevant searches. What I could not show was what those visitors had done after arriving or whether any of them had ever become customers. I had been optimising for a metric that was easy to measure and felt meaningful without checking whether it was actually connected to anything that mattered to the business.
The Metrics That Drive Revenue vs the Metrics That Feel Good
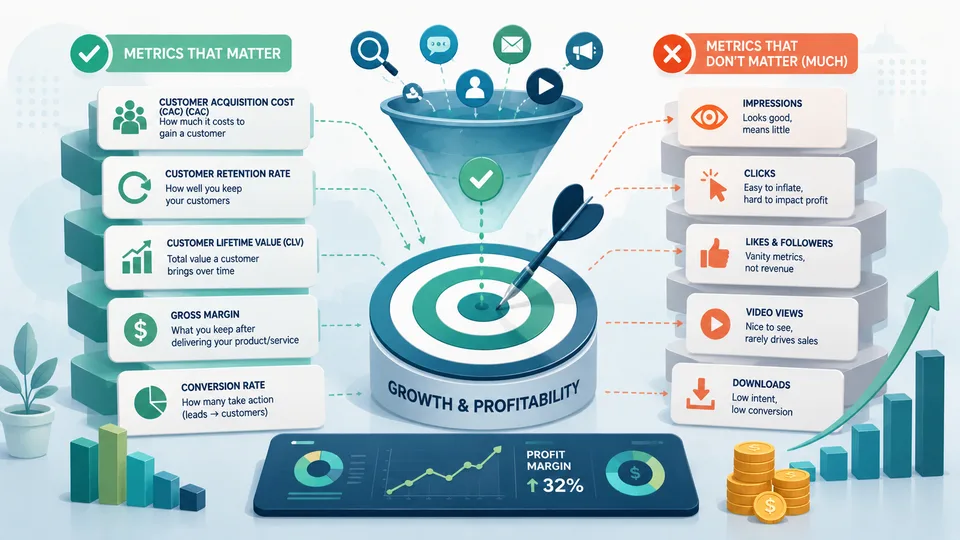
Vanity metrics — page views, social media followers, email list size, impressions — are easy to grow and satisfying to report. They are also largely disconnected from commercial outcomes unless there is a clear, verified path from the metric to revenue. A website with 50,000 monthly visitors that converts at 0.2% generates 100 leads. A website with 8,000 monthly visitors that converts at 3% generates 240 leads. The smaller site is outperforming commercially despite what every traffic-focused metric would suggest. The discipline of marketing measurement is always tracing the chain from activity to output to outcome: not just what happened, but what it caused, and whether what it caused mattered.
Customer Acquisition Cost: The Number That Determines Whether Marketing Is Profitable
CAC is total marketing and sales spend divided by new customers acquired in the same period. It is the most important marketing metric for most businesses because it directly answers the question of whether acquisition spending is generating a return. A business spending £12,000 per month on marketing and sales and acquiring 30 new customers has a CAC of £400. Whether that is good or bad depends entirely on what each customer is worth — the lifetime value. A CAC calculator tracks this consistently and by channel, so you can see not just the blended figure but which acquisition activities are generating customers at acceptable cost and which are not.
Conversion Rate: The Multiplier That Makes Everything Else More Efficient
Conversion rate — the percentage of people at each funnel stage who move to the next — is the metric that multiplies the effect of all upstream work. Doubling traffic while holding conversion rate constant doubles leads. Doubling conversion rate while holding traffic constant also doubles leads — but at a fraction of the cost. Conversion rate improvements apply to all existing traffic and pipeline, immediately. This is why conversion optimisation is frequently the highest-ROI marketing activity available, particularly for businesses that have already established traffic and pipeline volume. The specific conversion rates worth tracking depend on the business model: visitor-to-lead rate for lead generation businesses, lead-to-opportunity rate for sales-driven businesses, trial-to-paid rate for product businesses.
Return on Marketing Investment: Calculating It Correctly
Marketing ROI is often reported as (Revenue Attributable to Marketing ÷ Marketing Spend) × 100%. This is useful but systematically overstates true ROI because it uses revenue rather than gross profit in the numerator. A campaign that generates £50,000 in revenue at 30% gross margin produces £15,000 in gross profit. If the campaign cost £8,000, the ROI on gross profit is 87.5% — not the 525% that the revenue-based calculation produces. Using gross profit in ROI calculations makes comparisons between campaigns and channels meaningful. A ROI calculator that allows you to input gross margin gives you the accurate figure rather than a flattering one.
Payback Period: How Long Until the Marketing Investment Is Recovered
CAC and LTV together do not tell you about timing. A business with a CAC of £400 and an LTV of £2,000 has a healthy 5:1 ratio — but if monthly gross profit per customer is £40, payback is 10 months. During those 10 months, the business has capital committed and not yet recovered. For fast-growing businesses, this creates compounding cash pressure as more customers are acquired simultaneously. Tracking payback period alongside LTV:CAC gives a more complete picture of acquisition economics — particularly useful when comparing channels with similar LTV:CAC ratios but different payback profiles. A channel with faster payback is preferable, all else equal, because it releases capital for reinvestment sooner.
Churn Rate: The Marketing Metric That Is Not Usually Tracked by Marketing
Churn is typically owned by customer success or product teams, but it has direct implications for marketing efficiency. Every percentage point of improvement in retention increases the LTV of every customer marketing acquires. In a business with 5% monthly churn, reducing to 4% improves average customer lifetime by 25%. If marketing is generating 50 new customers per month at a CAC of £400, a 25% increase in their average lifetime value means every pound of marketing spend is now generating 25% more long-term revenue. The implication is that marketing leaders who do not track and influence retention metrics are managing only half the economic model they are responsible for.
Attribution Models and Why None of Them Are Fully Correct
Every marketing attribution model is a simplification. Last-click attribution — the most commonly used model in Google Analytics and similar tools — credits the final touchpoint before purchase with 100% of the conversion. This overstates the value of branded search and direct visits, which are typically the last step in a multi-touch journey, and understates the contribution of awareness-building activities earlier in that journey. First-click attribution has the opposite bias. Data-driven attribution, available in more sophisticated analytics setups, distributes credit across touchpoints based on statistical analysis of what sequence of touches is associated with conversion — but it requires significant volume to be reliable and still makes assumptions that may not reflect actual causality. The practical implication is that attribution data should inform marketing decisions directionally rather than being treated as a precise measurement. When two channels have similar attributed performance, factors outside the attribution model — audience quality, brand safety, future scalability — should influence the decision. When one channel dramatically outperforms another across all attribution models, the signal is reliable regardless of the model's limitations.
Metrics to Retire: What to Stop Tracking
Time spent tracking metrics that do not connect to decisions is time not spent improving the things that matter. Social media follower counts, average session duration, pages per session, and bounce rate are commonly reported and rarely actionable. Follower counts grow through content strategy and do not correlate reliably with commercial outcomes. Session duration and pages per session are affected by navigation design as much as user engagement. Bounce rate has been effectively retired by Google Analytics 4, which replaced it with engagement rate — a sign that even the tools' designers recognised it was poorly understood and frequently misinterpreted. A monthly marketing dashboard should contain between five and eight metrics that are directly connected to acquisition volume, acquisition cost, revenue contribution, and retention. Anything beyond that risks burying the signal in noise and making reporting feel comprehensive without being useful.
What to do next
Use the ideas above as a starting point — then connect them to your own numbers and related guides on Calc It Anything.
- Read the small business finance and growth guide for the wider cluster.
- Compare with What Is LTV:CAC and Why Every SaaS Founder Should Know It.
- Compare with What Is a Good LTV to CAC Ratio?.
- Run the relevant calculator on this site with your own inputs before making a decision.
Related reading
- small business finance and growth guide
- What Is LTV:CAC and Why Every SaaS Founder Should Know It
- What Is a Good LTV to CAC Ratio?
- Cost Per Acquisition Explained: When CAC Is Useful and When It Lies
Frequently asked questions
What LTV:CAC ratio is healthy for early-stage SaaS?
Many B2B SaaS teams aim for roughly 3:1 once gross margin and payback period are factored in, but consumer or low-margin models may need a higher ratio. Model your own payback months, not just the headline ratio.
Should I calculate LTV:CAC by channel or in aggregate?
Both. Company-wide ratios hide unprofitable channels subsidised by efficient ones. Segment by acquisition source and customer tier before reallocating spend.
Which lever usually moves LTV:CAC fastest?
Retention often beats cutting acquisition spend because churn sits in the LTV denominator. A one-point churn improvement can matter more than a double-digit CAC reduction.