I watched a small business owner lose money on a product line for eight months because she had confused markup and margin. She had decided she wanted to make a 40% margin on each product, calculated her selling price by adding 40% to the cost, and then wondered why the actual margin in her accounts was coming in around 28%. The distinction is not subtle when you see it written out — but in the moment of pricing a product, when you are thinking about what percentage to add to cost, it is entirely natural to conflate the two. Markup is calculated from cost. Margin is calculated from price. The same percentage means very different things depending on which direction you measure from.
The Formula Difference and Why It Matters
Markup percentage = (Selling Price - Cost) ÷ Cost × 100. Margin percentage = (Selling Price - Cost) ÷ Selling Price × 100. On a product costing £60 and selling for £100: markup is (£40 ÷ £60) × 100 = 66.7%. Margin is (£40 ÷ £100) × 100 = 40%. Same product, same prices, same profit. Two completely different percentages. The confusion arises because both are legitimate ways to express the same relationship — they just use different denominators. The practical problem is when someone says "I want a 40% margin" but calculates the selling price using the markup formula: £60 × 1.40 = £84. The actual margin on an £84 selling price is (£24 ÷ £84) × 100 = 28.6%, not 40%.
How to Convert Between the Two
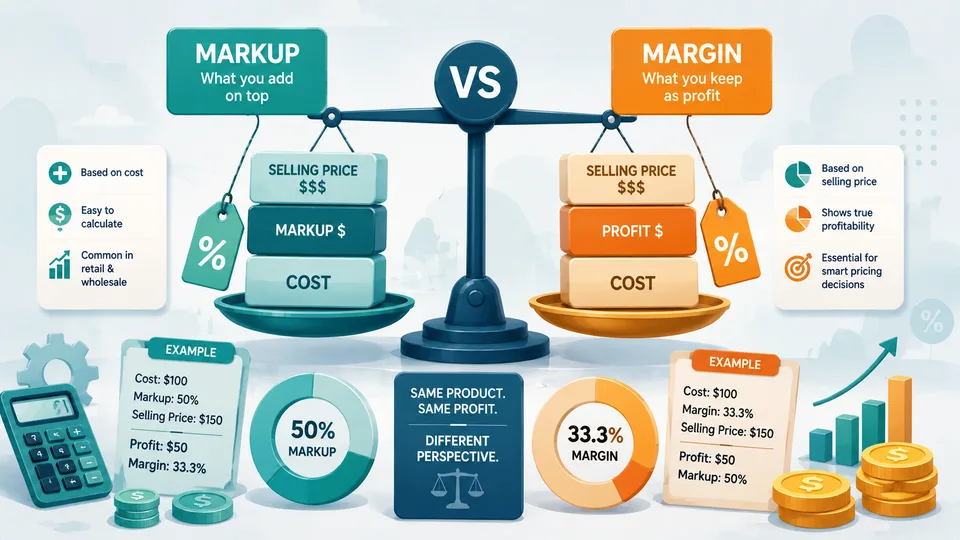
Markup to margin: Margin = Markup ÷ (1 + Markup). A 50% markup (0.5) gives a margin of 0.5 ÷ 1.5 = 33.3%. A 100% markup (1.0) gives a 50% margin. Margin to markup: Markup = Margin ÷ (1 - Margin). A 40% margin (0.4) requires a markup of 0.4 ÷ 0.6 = 66.7%. These conversions are worth knowing because different people in different functions tend to speak in different terms. Buyers and procurement teams often think in markup; finance teams usually think in margin. When a sales manager says they need 50% margin to make a deal worthwhile and the procurement team quotes costs on a 50% markup basis, the apparent agreement actually represents a 16-percentage-point difference in actual profitability. A markup calculator and profit margin calculator let you switch between both views instantly.
Which Metric to Use for Pricing Decisions
Margin is preferable for most business analysis because it tells you what proportion of revenue remains after covering cost — which is directly comparable across products with different price points. A 40% margin means 40p of every £1 of revenue flows toward fixed costs and profit, regardless of whether the product sells for £10 or £1,000. Markup is more intuitive in purchasing and buying contexts because it starts from the cost you know and asks how much to add. For operational decisions — comparing product profitability, setting minimum acceptable prices, modelling the impact of cost changes — margin is the more useful measure. For pricing conversations with buyers or distributors where cost is the starting point, markup may be the more natural language.
The Gross Margin Mistake That Hides True Profitability
Gross margin — the margin after deducting direct costs — is not the same as net profit margin, which accounts for all costs including fixed overheads. A business with 50% gross margin across all products sounds healthy. If total revenue is £300,000 and fixed costs are £160,000, operating profit is £150,000 - £160,000 = -£10,000. The gross margin was healthy; the business is losing money because fixed costs were too high relative to revenue. This distinction matters for pricing because gross margin is usually calculated at the product level, while fixed costs are shared across the business. A product with a healthy gross margin can appear profitable in isolation but fail to cover its share of overheads. Pricing decisions should account for contribution to fixed costs, not just the gross margin in isolation.
Negotiating Discounts Without Destroying Margin
A 10% discount on revenue has a disproportionate impact on margin because costs are fixed. On a product with 40% gross margin: revenue of £100, cost £60, gross profit £40. Apply a 10% discount: revenue £90, cost £60, gross profit £30. Gross margin falls from 40% to 33.3% — a 16.7% reduction in margin from a 10% discount. The lower the starting margin, the more amplified this effect becomes. A product with 20% gross margin receiving a 10% discount sees margin fall to 11.1% — nearly halved. This is why blanket discount policies are destructive and why discounts should be evaluated against their specific margin impact, not against the revenue reduction alone. A price reduction that "only" costs 10% in revenue can cost 25–30% of the profit on that transaction.
Using Margin Targets in Tender and Proposal Pricing
In businesses that price through tenders, proposals, or quotes, the confusion between markup and margin most often occurs at the point of building a price from cost. A project manager calculating a bid knows the estimated cost and knows the required margin — but if they apply the margin percentage as a markup on cost, the resulting price will consistently undershoot the margin target. On a £15,000 estimated cost project with a required 35% margin, the correct calculation is: Selling Price = Cost ÷ (1 - Margin) = £15,000 ÷ 0.65 = £23,077. A 35% markup on cost would produce a price of £20,250 and deliver only a 26% margin. Over time, systematically winning projects with a 26% actual margin when 35% was assumed produces chronic underperformance against financial targets — with no single bid looking obviously wrong. Building a margin-to-price formula into the standard quoting process, rather than relying on people to remember which calculation to use, eliminates this class of error entirely.
Margin by Product Line: The Mix Problem
Blended gross margin across a product portfolio conceals significant variation by product line. A business reporting 42% gross margin overall may have products ranging from 20% to 65% margin. The blended figure is driven by the mix of which products sell in which proportions. If the product mix shifts — through customer preference, competitive pressure, or sales team incentives — toward lower-margin lines, blended margin falls without any individual product changing its price or cost. Tracking gross margin by product or product category, rather than only in aggregate, reveals where profit is actually being generated and which lines are being subsidised by the rest of the portfolio. This also informs pricing strategy: products with low margins that are competitive with alternatives are candidates for either a cost review or a price increase; products with high margins that are underselling are candidates for increased investment in sales and marketing. The profit margin calculator and markup calculator are most useful when applied at this product level rather than as a blended business-wide calculation.
The most practical way to embed the distinction is to standardise on one term within your business and train anyone involved in pricing to use it consistently. Finance teams typically work in margin; buyers and procurement teams often think in markup. When these groups interact — in tender processes, in supplier negotiations, in product launch discussions — explicitly checking which basis is being used prevents the systematic pricing errors that arise when both parties think they are saying the same thing and are not. A five-minute conversation at the start of a pricing review costs nothing; discovering a margin miss three quarters into the year costs considerably more.
What to do next
Use the ideas above as a starting point — then connect them to your own numbers and related guides on Calc It Anything.
- Read the small business finance and growth guide for the wider cluster.
- Compare with Hidden Costs in Small Business: The Expenses Owners Forget.
- Compare with How Small Costs Destroy Profitability.
- Run the relevant calculator on this site with your own inputs before making a decision.
Related reading
- small business finance and growth guide
- Hidden Costs in Small Business: The Expenses Owners Forget
- How Small Costs Destroy Profitability
- The Hidden Costs of Building Software
Frequently asked questions
Why do small costs hurt profitable businesses?
Fixed overheads and low-margin revenue mean recurring £50–£200 leaks compound across dozens of line items. Margin looks fine on paper until you aggregate subscriptions, fees, and unused seats.
How often should I review business running costs?
A lightweight quarterly pass on software, payment fees, and contractor spend catches drift early. Tie the review to one metric — gross margin or monthly burn — so it stays actionable.
Is cutting costs always the right response?
No. Cut spend that does not protect revenue or retention first. Protect customer-facing delivery and anything with measurable ROI before across-the-board austerity.