LTV:CAC tells you whether each new customer pays back acquisition spend with room for everything else.
The famous 3:1 rule is a shorthand for B2B SaaS with healthy gross margins — not a law for every model. A good ratio depends on payback period, margin, and how fast you can reinvest in growth.
It belongs in our saas metrics churn startup finance guide, alongside how to reduce churn increase retention and why most freemium models fail. Use the ltv vs cac breakeven calculator when you want to model your own numbers.
Benchmarks
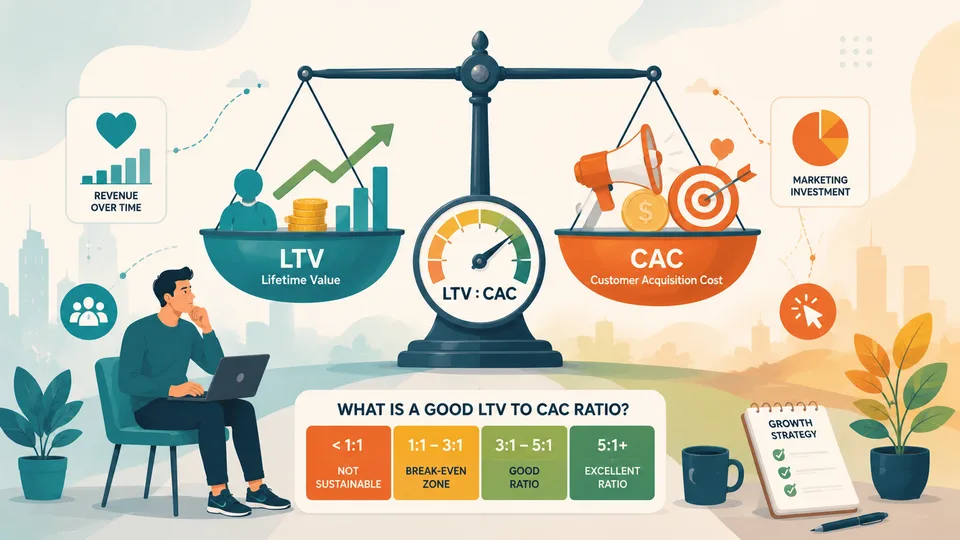
The 3:1 LTV:CAC ratio is widely cited as the standard threshold for a healthy SaaS or subscription business. At this ratio, every pound spent acquiring a customer returns three pounds of gross profit over the customer's lifetime. The 2:1 spread above breakeven is typically considered sufficient to cover general and administrative costs, product development, and provide a return to investors.
At below 3:1, the economics are generally considered marginal — viable in some models, but with insufficient margin for execution risk, competitive pressure, or cost increases. Below 1:1, the business is destroying value with each acquisition regardless of revenue growth.
Above 5:1, the ratio suggests under-investment in acquisition — the business could likely grow faster by spending more on sales and marketing, since the return on each additional pound of acquisition spend remains strong. The theoretical optimal ratio is not maximised — it is calibrated to the point where additional acquisition spend is still returning above the required hurdle rate.
The LTV vs CAC Calculator shows your current ratio alongside the standard benchmarks, and models how the ratio changes under different churn, pricing, and acquisition cost scenarios.
Industry Standards
The 3:1 benchmark applies most cleanly to B2B SaaS with monthly subscription pricing. In other contexts, appropriate ratios differ:
E-commerce with repeat purchase: LTV calculations include the probability of repeat purchase rather than a subscription term. The appropriate ratio depends heavily on gross margin — a high-margin direct-to-consumer brand might target 4:1 or higher; a low-margin product business might operate sustainably at 2:1.
Enterprise software with long sales cycles: CAC is typically very high (long sales process, enterprise sales team costs) and LTV is also very high (multi-year contracts, high switching costs). Ratios of 5:1 to 8:1 are common and necessary to justify the extended sales investment. The CAC payback period is typically 18 to 36 months, which requires significant capital to fund growth.
Consumer subscription at scale: High-volume, low-price consumer subscriptions (streaming services, fitness apps) often operate at lower LTV:CAC ratios because CAC is low (digital acquisition at scale) and LTV is moderate. A 2:1 ratio can be sustainable when the absolute economics are strong and payback is fast.
Marketplace businesses: Two-sided marketplaces have separate acquisition costs for supply and demand sides. The combined CAC must be measured against the net revenue per transaction multiplied by transaction frequency — a fundamentally different calculation than single-sided subscription businesses.
Warning Signs
Several patterns indicate that LTV:CAC is deteriorating before it appears in summary metrics:
Rising CAC with stable churn: Acquisition costs tend to rise as a business scales — the most efficient channels saturate and each additional customer costs more than the last. If LTV is not improving alongside CAC increases, the ratio compresses over time. A business that achieved 4:1 at £200 CAC may find itself at 2:1 when CAC has risen to £400 while LTV has remained flat.
Declining cohort retention: If customers acquired in recent months are churning faster than those acquired a year ago, LTV is declining even if headline churn rates look stable. Cohort analysis — tracking the retention of each acquisition cohort separately — reveals this deterioration earlier than aggregate metrics.
CAC payback extending beyond 12 months: When it takes more than a year to recover acquisition costs, the business requires continuous capital to fund the gap between acquisition spend and recovery. This is sustainable with strong investor backing but creates fragility if funding conditions change.
LTV calculated on revenue rather than gross profit: A surprisingly common error — calculating LTV on revenue and CAC on cost produces a ratio that flatters the economics by ignoring the cost of delivering the service. Always use gross profit in the LTV calculation, never revenue. A business with 40% gross margins has an LTV that is 40% of what a revenue-based calculation would show.
Worked example: LTV:CAC at different churn levels
A subscription product charges £80 per month at 75% gross margin. CAC is £240. At 3% monthly churn, average lifetime is about 33 months and gross LTV is roughly £1,980 (33 × £80 × 0.75). LTV:CAC ≈ 8.3:1 — strong headroom.
If churn rises to 5% monthly, lifetime falls to about 20 months and gross LTV drops to roughly £1,200. The same CAC now yields 5:1 — still acceptable for many SaaS businesses, but acquisition that looked conservative at 3% churn is marginal at 5%.
If the team mistakenly uses revenue instead of gross profit for LTV, they would calculate £2,640 LTV at 3% churn and think they can spend far more on ads than economics allow. Always align LTV and CAC on the same profit basis.
Check results in the cac calculator and see how many free users to make money for related guidance.
What to do next
- Calculate gross margin LTV using cohort retention, not headline churn alone.
- Enter CAC fully loaded (ads, sales salaries, tools, creative).
- Compare your ratio to required payback in the LTV vs CAC breakeven calculator.
- Track ratio quarterly — rising CAC with flat LTV is an early warning.
- Segment by channel; blended averages hide broken acquisition lines.
This article is for general planning and education — not professional financial, tax, or legal advice. Figures are illustrative; check current terms and your own numbers before acting.
Frequently asked questions
Is 3:1 LTV:CAC always the target?
It is a common benchmark for B2B SaaS with 12-month payback tolerance. Low-margin or long-payback models may need higher ratios; high-velocity consumer apps sometimes operate lower if payback is very fast.
Should LTV use revenue or gross profit?
Gross profit. Revenue-based LTV overstates health when delivery costs are material.
What if my ratio is above 5:1?
You may be under-spending on acquisition and growing slower than economics allow — if retention is stable. Confirm LTV is not inflated by a temporary low-churn cohort.
How does payback period relate to LTV:CAC?
A viable ratio with 18-month payback still needs cash to fund the gap. Runway and churn matter as much as the headline ratio.
Do marketplace businesses use the same ratio?
Usually not directly — you have two sides and transaction economics. Adapt the framework to contribution per order or per active buyer/seller.